

前面文章說:MACD+KDJ指標副圖疊加=MJ指標 ,小編說:您可以參考複製內建的MACD指標和KDJ指標,然後稍作修改即可。我修改後程式如下:
//MJ指標
// XQ: MACD指標//
input: FastLength(12), SlowLength(26),MACDLength(9);
variable: price(0);
SetInputName(1, "DIF短天數");
SetInputName(2, "DIF長天數");
SetInputName(3, "MACD天數");
price = WeightedClose();
Value1 = XAverage(price, FastLength) -
XAverage(price, SlowLength);
Value2 = XAverage(Value1, MACDLength) ;
Value3 = Value1 - Value2 ;
// 前面區段資料變動較大, 先不繪出
if CurrentBar <= SlowLength then begin
Value1= 0;
Value2= 0;
Value3= 0;
end;
Plot1(Value3, "OSC");Plot3(0, "MACD0");
// XQ: KDJ指標//
input: Length(9), RSVt(3), Kt(3), JType(0);
variable: rsv(0), k(0), _d(0), j(0);
SetInputName(1, "天數");
SetInputName(2, "RSVt權數");
SetInputName(3, "Kt權數");
Stochastic(Length, RSVt, Kt, rsv, k, _d);
if JType = 0 then j = 3 * k - 2 * _d
else j = 3 * _d - 2 * k;
Plot2(J,"J(%)");
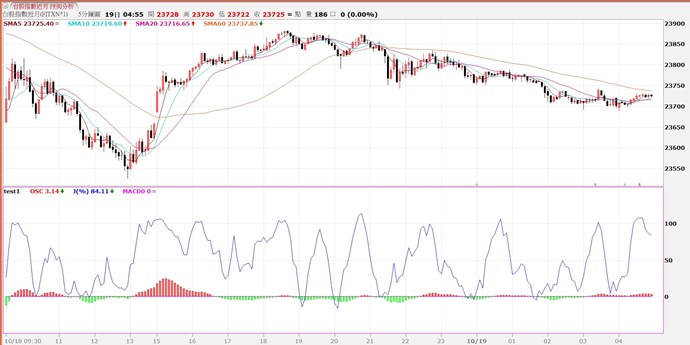
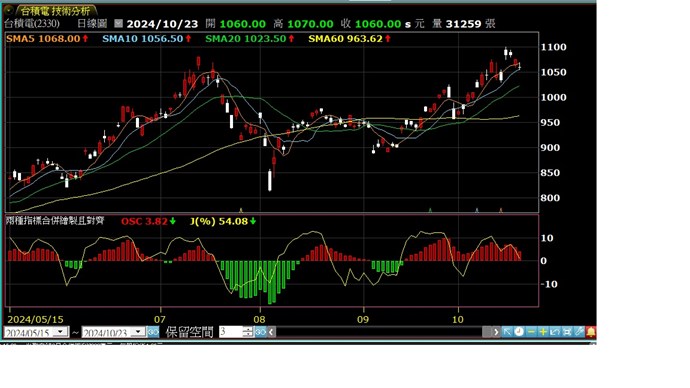
但發現當頻率為1分鐘 , macd 0軸跟kdj 50軸可以重疊, 如附圖1!
但當頻率改為5分鐘 , macd 0軸跟kdj 50軸就位移了, 如附圖2!


12 評論