
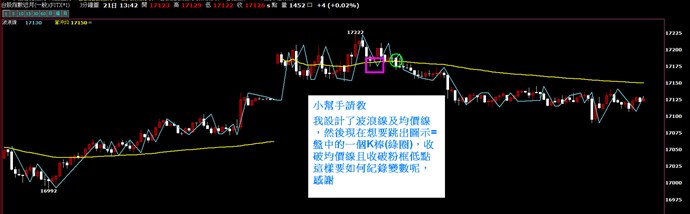
小幫手請教
我設計了波浪線及均價線,然後現在想要跳出圖示=盤中的一個K棒(綠圈),收破均價線且收破粉框低點
這樣要如何紀錄變數呢,感謝。
波浪線
input:_L(5);
condition1 = H[2] = highest(H,_L);
condition2 = L[2] = lowest(L,_L);
if condition1 then plot1(h[2],"") else if condition2 then plot1(l[2],"");

小幫手請教
我設計了波浪線及均價線,然後現在想要跳出圖示=盤中的一個K棒(綠圈),收破均價線且收破粉框低點
這樣要如何紀錄變數呢,感謝。
波浪線 input:_L(5); condition1 = H[2] = highest(H,_L); condition2 = L[2] = lowest(L,_L); if condition1 then plot1(h[2],"") else if condition2 then plot1(l[2],"");
Hi 小幫手,請教大概何時會回覆到7天前的問題呢?感謝~~
Hello 風期會,
就條件來看,您粉框的價格應該是最近符合condition2的數值,所以如果是小幫手的話會這樣寫:
condition2 = L[2] = lowest(L,_L);
if condition2 then value1 = l[2]; //value1紀錄最近符合condition2的數值
condition3 = open > getfield("均價") and open > value1 and close < getfield("均價") and close < value1; //開盤在均價和value1上,收盤在兩者之下
condition3 就會是符合收盤跌破均價線和符合condition2低點的Bar。
另外小幫手補充,小幫手回覆時都是由討論區的後面往前面回覆。(優先回覆較早發問的用戶)
所以如果您在同一篇文章推文的話會造成您的文章被往前推,反而讓小幫手看到問題的時間變晚。
由於近來問題量很多,麻煩您發問後多等待一陣子。
感謝。

感謝小幫手


3 評論