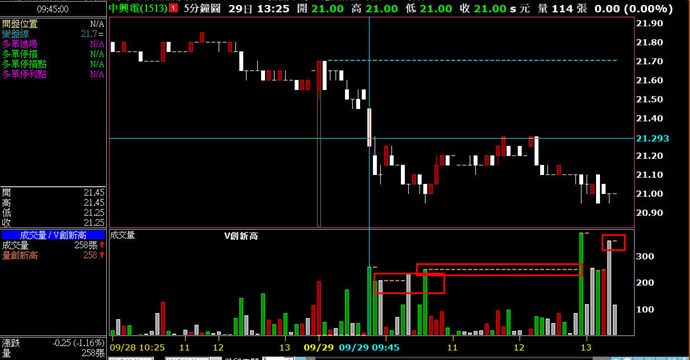
小編你好
想請敎一下指標畫不出來的問題
想在宊破 value3 這條水平線時幫我畫秀出一個訊號
腳本如下
if barfreq<> "Min" or barinterval <> 5 then raiseruntimeerror("僅適用5分鐘線");
// if date <> date[1] then return;
//settotalbar(54);
variable:bsflag(0);
variable:bprice(0);
if time=090000 then
begin
value1 = GetField("收盤價","5");
value2 =GetField("收盤價","15");
end;
if time>= 091500 then
begin
value3=iff(value1 >= value2,value1,value2);
plot2(Value3,"value3");
end;
//========================================================================
condition1 = time>= 091500 and
o <= value3 and C > Value3 or
c[1]=value3 and o > value3 and
c > o and bsflag=0;
if bsflag=0
and condition1
then begin
bsflag=1;
bprice=Value3;
plot3(bprice,"訊號");
end;
感謝教導


10 評論