
小編你好:
請問如果一條移動線我要根據不同的數值範圍標示不同的顏色,比如我將數值為四個區段,線條進入不同區段,各以plot1,plot2,plot3,plot4用不同顏色標示,但XQ會自動連接線條,在線段交接處常會有2-3條線段,會分不清哪條是真的線條,
哪條是XQ自動連接的線條,請問如何取消線段連接,如同excel可以選擇自動將斷點連接或顯示零或不連接.

小編你好:
請問如果一條移動線我要根據不同的數值範圍標示不同的顏色,比如我將數值為四個區段,線條進入不同區段,各以plot1,plot2,plot3,plot4用不同顏色標示,但XQ會自動連接線條,在線段交接處常會有2-3條線段,會分不清哪條是真的線條,
哪條是XQ自動連接的線條,請問如何取消線段連接,如同excel可以選擇自動將斷點連接或顯示零或不連接.
小幫手你好:
我用了noplot的語法仍無法消除,腳本如下:
var: bvolume(0),svolume(0),sbmargin(0);
bvolume=getfield("累買成筆","1");
svolume=getfield("累賣成筆","1");
sbmargin=svolume-bvolume;
if sbmargin >= 1000 then
begin
plot1(sbmargin,"成交力差");
noplot(2);
noplot(3);
noplot(4);
end
else begin
if sbmargin >= 0 then
begin
plot2(sbmargin,"成交力差");
noplot(1);
noplot(3);
noplot(4);
end
else begin
if sbmargin > -1000 then
begin
plot3(sbmargin,"成交力差");
noplot(1);
noplot(2);
noplot(4);
end
else begin
plot4(sbmargin,"成交力差");
noplot(1);
noplot(2);
noplot(3);
end;
end;
end;

小幫手你好:
如果我用XAverage (somevar,length)對一組變數作移動平均,在每天開盤要將前面(lenghth-1)個數的變數清為0,我不想取到前一天的資料,我是否可將變數somevar宣告為陣列,系統是否會自動認定somevar[0],為當前的資料,somevar[1]為前一筆資料,somevar[2]為前二筆資料,..,以此類推.
我用getfield取得當前資料,是否可存入somevar[0],
PaulChen 您好
我幫您稍微修改掉兩個BEGIN..END 後是可以使用的喔
var: bvolume(0),svolume(0),sbmargin(0);

bvolume=getfield("累買成筆","1");

svolume=getfield("累賣成筆","1");

sbmargin=svolume-bvolume;

if sbmargin >= 1000  then

begin

plot1(sbmargin,"成交力差");

noplot(2);

noplot(3);

noplot(4);

end

else

     if sbmargin >= 0 then

begin

     plot2(sbmargin,"成交力差");

noplot(1);

noplot(3);

noplot(4);

end

else

          if sbmargin > -1000  then

   begin

           plot3(sbmargin,"成交力差");

   noplot(1);

   noplot(2);

   noplot(4);

   end

      else begin

           plot4(sbmargin,"成交力差");

   noplot(1);

   noplot(2);

   noplot(3);

           end;
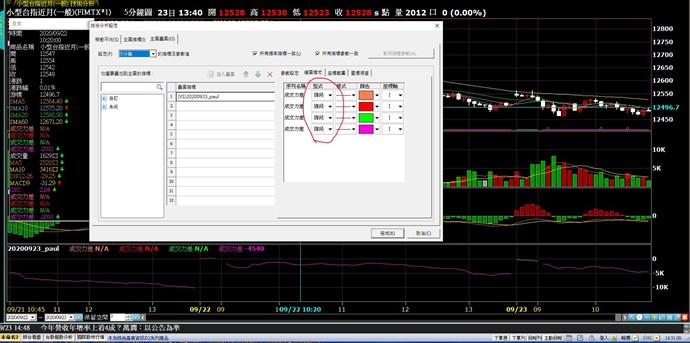
請在指標設定中,選擇「線段」才能達成NOPLOT的效果
PaulChen 您好
A1:如果您的數值是字串的話,就可以放在指數平均的語法之中
A2: getfield取得的數值如果是常數 是可以放到變數中的,這沒問題
小幫手你好:
我的意思是如何把當下資料往前的10筆或20筆資料清為0,以下面腳本為例如何在開盤時間084500,將往前26筆資料清為0,亦即不使用到前一交易日的資料.
input: FastLength(12), SlowLength(26), MACDLength(9);
variable: oscbar(0),n(0);
array:sbmargin[ ](0),bvolume[ ](0),svolume[ ](0);
SetInputName(1, "DIF短天數");
SetInputName(2, "DIF長天數");
SetInputName(3, "MACD天數");
bvolume[0]=getfield("累買成筆");
svolume[0]=getfield("累賣成筆");
sbmargin[0]=svolume[0]-bvolume[0];
//開盤將前面長天數的買賣筆差全部歸零
if time>=084500 and time<084600 then begin
for n=1 to SlowLength-1
begin
sbmargin[n]=0;
end;
end;
Value1 = XAverage(sbmargin[0], FastLength) - XAverage(sbmargin[0], SlowLength);
Value2 = XAverage(Value1, MACDLength) ;
oscbar = Value1 - Value2 ;
// 前面區段資料變動較大, 先不繪出
//
if CurrentBar <= SlowLength then
oscbar = 0;
if oscbar > oscbar[1] then
begin
noplot(2);
Plot1(oscbar, "Osc");
end
else
begin
noplot(1);
Plot2(oscbar, "Osc");
end;
編輯沒出現問題,執行時卻出現"存取陣列時超過範圍",不知以陣列來表示當前資料往前的數筆資料是否正確的作法?
小幫手:
請問以陣列方式是否可以達到清除當下往前數筆資料(如上述)? 或有更好的方式,請告知.
PaulChen 您好
您可以使用 Array_Copy語法 ;先建立一組0的 陣列 當您想歸零的時後直接貼上即可
只是我有點不太懂得是,為何您使用"累買成筆數"相關資料要用陣列去算?
看您的code給我的感覺像是您想紀錄當天的累買成筆數 然後跨日就清掉
但我們本來的累買成筆數就是跨日就會清除且單日累積的


11 評論