
請問 警示腳本 與 指標腳本 內容是相同的,但是執行上卻有時間上的落差,可能會是那些問題所造成呢?

您好:
請您提供警示腳本與指標腳本的程式碼,
小編幫您查查是哪出了問題,謝謝。
這是指標腳本
//進出場訊號
input: FastLength(12), SlowLength(26), MACDLength(9); //定義MACD
input: KDLength(9), RSVt(3), Kt(3); //定義KD指標
input: ShortLength(6), LongLength(14); //定義RSI指標
variable: price(0), rsv(0), k(0), _d(0); //定義KD指標
variable: intrabarpersist position(0); // 目前位置
variable: intrabarpersist entry_price(0); // 最後一次進場的價格
price = WeightedClose();
Value1 = 0; //定義分數
//計算MACD的各項數值
Value2 = XAverage(Price, FastLength) - XAverage(Price, SlowLength); //DIF線
Value3 = XAverage(Value2, MACDLength) ; //MACD線
Value4 = Value2 - Value3 ; //Osc柱狀體
if CurrentBar <= SlowLength then
begin
Value2 = 0;
Value3 = 0;
Value4 = 0;
end;
//計算KD
//SetTotalBar(maxlist(KDLength,6) * 3);
Stochastic(KDLength, RSVt, Kt, rsv, k, _d);
//計算RSI
Value998 = RSI(Close, ShortLength); //RSI短天期的數值
//篩選加分的條件
condition1 = Value4 > 0;
condition2 = Value4[1] < 0;
if condition1 and condition2 then Value1 = Value1 + 5; //MACD出現第一根紅兵
condition3 = Value4[2] > 0;
condition4 = Value4[1] > 0;
condition5 = Value4[2] > Value4[1];
condition6 = Value4 > Value4[1];
if condition3 and condition4 and condition5 and condition6 then Value1 = Value1 + 2; //MACD出現紅2兵
if Value4 > Value4[1] then Value1 = Value1 + 1; //MACD紅兵持續上漲或綠兵收斂
condition7 = k >= 50;
condition8 = k[1] < 50;
if condition7 and condition8 then Value1 = Value1 + 3; //K線突破50向上
condition39 = k > k[1];
condition40 = k[1] > k[2];
if condition39 and condition40 then Value1 = Value1 + 1; //K線持續向上
condition9 = k >= 80;
condition10 = k[1] < 80;
if condition9 and condition10 then Value1 = Value1 + 4; //KD高檔鈍化剛開始
condition11 = k > 20;
condition12 = k[1] <= 20;
if condition11 and condition12 then Value1 = Value1 + 4; //KD低檔鈍化剛結束
if Value2 > 5 then Value1 = Value1 + 1; //DIF > 5
condition16 = Value998 >= 78;
condition17 = Value998[1] < 78;
if condition16 and condition17 then Value1 = Value1 + 2; //短天期RSI持續向上 > 75
condition35 = Value998 >= 50;
condition36 = Value998[1] < 50;
if condition35 and condition36 then Value1 = Value1 + 3; //短天期RSI突破50向上
//篩選扣分的條件
condition18 = Value4 < 0;
condition19 = Value4[1] > 0;
if condition18 and condition19 then Value1 = Value1 - 5; //MACD出現第一根綠兵
condition20 = Value4[2] < 0;
condition21 = Value4[1] < 0;
condition22 = Value4[2] < Value4[1];
condition23 = Value4 < Value4[1];
if condition20 and condition21 and condition22 and condition23 then Value1 = Value1 - 2; //MACD出現綠2兵
if Value4 < Value4[1] then Value1 = Value1 - 1; //MACD紅兵收斂或綠兵持續下跌
condition24 = k < 50;
condition25 = k[1] >= 50;
if condition24 and condition25 then Value1 = Value1 - 3; //K線跌破50向下
condition41 = k < k[1];
condition42 = k[1] < k[2];
if condition41 and condition42 then Value1 = Value1 - 1; //K線持續向下
condition26 = k <= 20;
condition27 = k[1] > 20;
if condition26 and condition27 then Value1 = Value1 - 4; //KD低檔鈍化剛開始
condition28 = k < 80;
condition29 = k[1] >= 80;
if condition28 and condition29 then Value1 = Value1 - 4; //KD高檔鈍化剛結束
if Value2 < -5 then Value1 = Value1 - 1; //DIF < -5
condition33 = Value998 <= 20;
condition34 = Value998[1] > 20;
if condition33 and condition34 then Value1 = Value1 - 2; //短天期RSI持續向下 < 20
condition37 = Value998 < 50;
condition38 = Value998[1] >= 50;
if condition37 and condition38 then Value1 = Value1 - 3; //短天期RSI跌破50向下
if position = 0 then
begin
if Value1 >= 10 then //進場邏輯
begin
position = 1;
entry_price = close;
print("(ENTRY) Date:", Date, " EntryPrice:", entry_price);
plot1(low -5, "買進");
end;
end
else
begin
if Value1 <= -10 then //出場邏輯
begin
position = 0;
entry_price = 0;
print("(EXIT) Date:", Date);
plot2(high +5, "賣出");
end;
end;
這是警示腳本
//一分鐘盤自動下單
input: FastLength(12), SlowLength(26), MACDLength(9); //定義MACD
input: KDLength(9), RSVt(3), Kt(3); //定義KD指標
input: ShortLength(6), LongLength(14); //定義RSI指標
variable: price(0), rsv(0), k(0), _d(0); //定義KD指標
variable: intrabarpersist position(0); // 目前位置
variable: intrabarpersist entry_price(0); // 最後一次進場的價格
price = WeightedClose();
Value1 = 0; //定義分數
//計算MACD的各項數值
Value2 = XAverage(Price, FastLength) - XAverage(Price, SlowLength); //DIF線
Value3 = XAverage(Value2, MACDLength) ; //MACD線
Value4 = Value2 - Value3 ; //Osc柱狀體
if CurrentBar <= SlowLength then
begin
Value2 = 0;
Value3 = 0;
Value4 = 0;
end;
//計算KD
//SetTotalBar(maxlist(KDLength,6) * 3);
Stochastic(KDLength, RSVt, Kt, rsv, k, _d);
//計算RSI
Value998 = RSI(Close, ShortLength); //RSI短天期的數值
//篩選加分的條件
condition1 = Value4 > 0;
condition2 = Value4[1] < 0;
if condition1 and condition2 then Value1 = Value1 + 5; //MACD出現第一根紅兵
condition3 = Value4[2] > 0;
condition4 = Value4[1] > 0;
condition5 = Value4[2] > Value4[1];
condition6 = Value4 > Value4[1];
if condition3 and condition4 and condition5 and condition6 then Value1 = Value1 + 2; //MACD出現紅2兵
if Value4 > Value4[1] then Value1 = Value1 + 1; //MACD紅兵持續上漲或綠兵收斂
condition7 = k >= 50;
condition8 = k[1] < 50;
if condition7 and condition8 then Value1 = Value1 + 3; //K線突破50向上
condition39 = k > k[1];
condition40 = k[1] > k[2];
if condition39 and condition40 then Value1 = Value1 + 1; //K線持續向上
condition9 = k >= 80;
condition10 = k[1] < 80;
if condition9 and condition10 then Value1 = Value1 + 4; //KD高檔鈍化剛開始
condition11 = k > 20;
condition12 = k[1] <= 20;
if condition11 and condition12 then Value1 = Value1 + 4; //KD低檔鈍化剛結束
if Value2 > 5 then Value1 = Value1 + 1; //DIF > 5
condition16 = Value998 >= 78;
condition17 = Value998[1] < 78;
if condition16 and condition17 then Value1 = Value1 + 2; //短天期RSI持續向上 > 75
condition35 = Value998 >= 50;
condition36 = Value998[1] < 50;
if condition35 and condition36 then Value1 = Value1 + 3; //短天期RSI突破50向上
//篩選扣分的條件
condition18 = Value4 < 0;
condition19 = Value4[1] > 0;
if condition18 and condition19 then Value1 = Value1 - 5; //MACD出現第一根綠兵
condition20 = Value4[2] < 0;
condition21 = Value4[1] < 0;
condition22 = Value4[2] < Value4[1];
condition23 = Value4 < Value4[1];
if condition20 and condition21 and condition22 and condition23 then Value1 = Value1 - 2; //MACD出現綠2兵
if Value4 < Value4[1] then Value1 = Value1 - 1; //MACD紅兵收斂或綠兵持續下跌
condition24 = k < 50;
condition25 = k[1] >= 50;
if condition24 and condition25 then Value1 = Value1 - 3; //K線跌破50向下
condition41 = k < k[1];
condition42 = k[1] < k[2];
if condition41 and condition42 then Value1 = Value1 - 1; //K線持續向下
condition26 = k <= 20;
condition27 = k[1] > 20;
if condition26 and condition27 then Value1 = Value1 - 4; //KD低檔鈍化剛開始
condition28 = k < 80;
condition29 = k[1] >= 80;
if condition28 and condition29 then Value1 = Value1 - 4; //KD高檔鈍化剛結束
if Value2 < -5 then Value1 = Value1 - 1; //DIF < -5
condition33 = Value998 <= 20;
condition34 = Value998[1] > 20;
if condition33 and condition34 then Value1 = Value1 - 2; //短天期RSI持續向下 < 20
condition37 = Value998 < 50;
condition38 = Value998[1] >= 50;
if condition37 and condition38 then Value1 = Value1 - 3; //短天期RSI跌破50向下
if position = 0 then
begin
if Value1 >= 10 then //進場邏輯
begin
position = 1;
entry_price = close;
print("(ENTRY) Date:", Date, " EntryPrice:", entry_price);
ret = 1;
end;
end
else
begin
if Value1 <= -10 then //出場邏輯
begin
position = 0;
entry_price = 0;
print("(EXIT) Date:", Date);
ret = 1;
end;
end;
您好:
小編看了一下您的腳本程式碼,
發現您並沒有使用 settotalbar 設定讀取資料範圍,
有可能是因為這個原因,導致造成您的問題,
資料讀取範圍與腳本執行關係 該連結網頁有詳細說明,請您抽空查看,以免造成您重複的困擾,謝謝。
在 資料讀取範圍與腳本執行關係 說明網頁中,有說明各腳本類型,資料讀取範圍相關說明,
--> 指標腳本類型為,
指標總共要畫多少筆K棒,不包含當日即時的K棒範圍。預設值是商品的全部資料長度。
--> 警示腳本類型為,
警示腳本要先執行多少筆之後開始進行即時的洗價以及是否要觸發。請注意這個範圍不包含當日即時的K棒。預設值是200。
假設資料讀取範圍是10的話,那警示腳本會先執行當日之前的10根K棒,接下來執行當日即時的K棒,接下來等待收到即時資料後在執行時才會判斷是否要觸發。
有可能是因為指標類型腳本與警示類型腳本,資料讀取範圍預設值不同(如兩個類型腳本說明,粗斜體部分),導致您的問題發生。
小編提供一個解決方法,請您試試看,
該方法就是將您的指標腳本與警示腳本,資料讀取範圍設為一致,
小編查看您有使用到 MACD 、 KD 與 RSI 指標,因此須依照上述三個指標的資料期間,去設定資料讀取範圍,
您可以參考XS內建警示腳本,MACD黃金交叉、KD高檔死亡交叉與RSI黃金交叉,
這三個內建警示腳本有【MACD 、 KD 與 RSI 指標】三個指標 資料讀取範圍設定 的程式碼,
將此三個指標的資料讀取範圍設定,取最大值,應該就能設定正確的資料讀取範圍期間,如下程式碼
settotalbar( maxlist( (maxlist(FastLength,SlowLength,6) + MACDLength * 3 + 8) , (maxlist(KDLength,6) * 3 + 8) , (maxlist(ShortLength,LongLength,6) * 8 + 8) ) );
請將此程式碼,加入您的指標與警示腳本,測試看看,希望能解決您的問題。
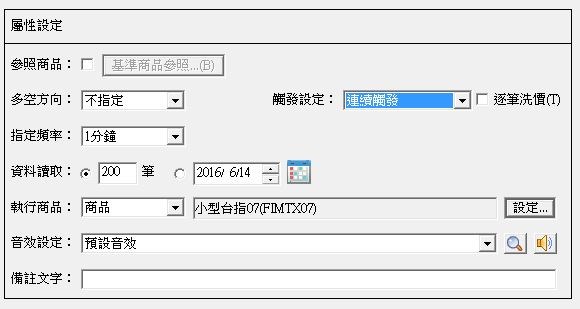
您好,測試後還是有些許落差,如果我想讓警示腳本抓
商品的全部資料長度,該如何定義呢?
您好:
抱歉,小編沒有仔細看過您的策略雷達設定,
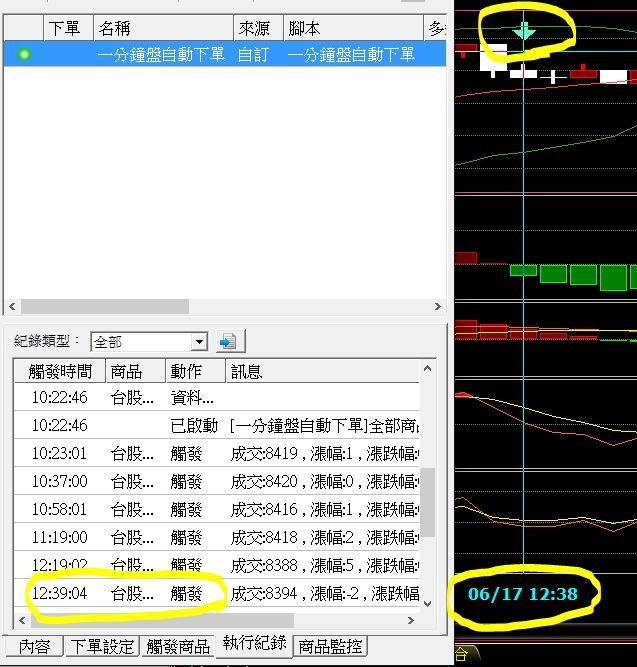
您提供的第二張圖,尚未勾選逐筆洗價,請您勾選逐筆洗價,測試看看是否還會有落差,如圖
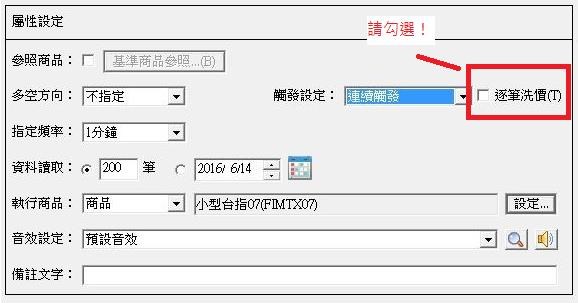
原因是,為了追求時效,我們把洗價模式設定成逐筆洗價,表示當有價格成交時就馬上執行腳本,而不是等到1分鐘K棒結束時才執行腳本。
相關的策略雷達觸發設定方式的應用,可以參考連結網頁,有詳細說明。
另外您詢問有關,警示腳本商品的全部資料長度的定義,
抱歉,目前沒有提供全部資料長度的定義,請您自行設定資讀取範圍,謝謝。
您好:
小編補充說明,
XQ指標圖上K棒畫的時間,是開始時間,
所以,
您提供的第一張圖,當中的指標K棒圖,標示的時間為12: 38
12: 38 = 12: 38:00 ~ 12: 38:59
因此,
K棒時間顯示12: 38,並不是如您想的慢了1分鐘,
而是在 12: 39:00 的時間點,
收到12: 39這根K棒的第一筆資料,且確認12: 38這根K棒結束後,觸發。
所以您看一下,您的歷史觸發紀錄,
10: 37:00
10: 58:01
11: 19:00
12: 19:02
12: 39:04
這些時間,都是下一根K棒的第一筆Tick的時間,這是市場決定的,因此不會每次剛好都在00秒的時間上,
此外,小編觀察您的觸發歷史紀錄,含有00秒的觸發歷史紀錄,因此並沒有慢。


7 評論