
請問日夜盤開盤價可以分別顯示嗎?
如圖,
1/17日盤開盤價是14923,但指標判別仍為1/16夜盤開盤價14926。
自編語法如下,請小編指教。
plot1(openD(0), "開盤價");

Hello 慕容宓,
您可以另外用變數在對應的時間記錄。
舉例來說,分鐘頻率的狀況下:
if time = 084500 then value1 = open;
if time = 150000 then value2 = open;
plot1(value1, "0845開盤");
plot2(value2, "1500開盤");
實測結果會跑出兩條開盤價 但這並不是我想要的。
參考下圖是否為您想要的呈現
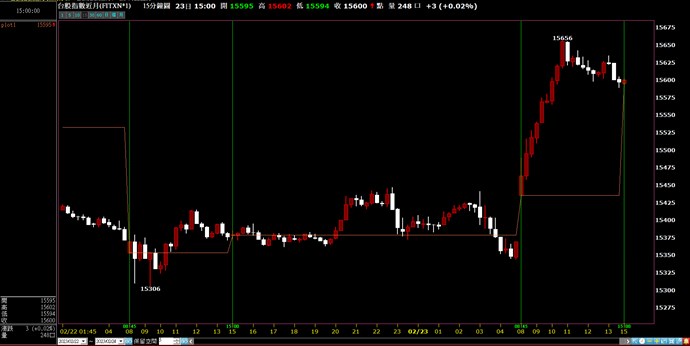
if time=150000 then value1=Open;

if time=084500 then value2=Open;

if time>=150000 or time<050000 then plot1(value1)
else if time>=084500 and  time<134500 then plot1(value2);
歐歐歐~
感謝大大~~


4 評論