

指標的邏輯如下:
如有買進訊號,指標會在畫面打一個桃紅色的突波。
variable:period(0);

period = 4.5*60;//270

variable:LR_Slope_(0);
LR_Slope_=linearregslope(close,period);
plot66(LR_Slope_,"LR_Slope_");

variable:MA_period_(0);
MA_period_=average(close,period);

if close < MA_period_
    and LR_Slope_ > 1*LR_Slope_[1]
    and MA_period_ > MA_period_[135]
    and MA_period_ > MA_period_[10]
then plot24(0.01)
else plot24(0);
策略的邏輯如下:
如上述指標,將畫出突波,改成 ret=1;
variable:period(0);

period = 4.5*60;//270

variable:LR_Slope_(0);
LR_Slope_=linearregslope(close,period);
//plot66(LR_Slope_,"LR_Slope_");

variable:MA_period_(0);
MA_period_=average(close,period);

if close < MA_period_
    and LR_Slope_ > 1*LR_Slope_[1]
    and MA_period_ > MA_period_[135]
    and MA_period_ > MA_period_[10]
then ret=1;
//then plot24(0.01)
//else plot24(0);
針對 茂林-KY(4935.TW) 做回測,回測設定如下:
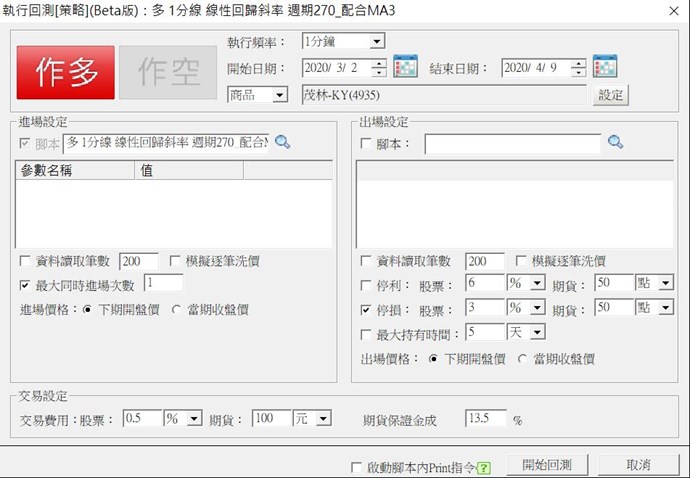
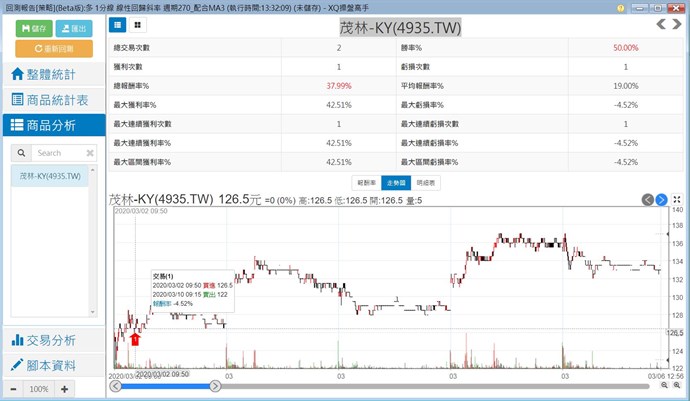
回測結果如下:
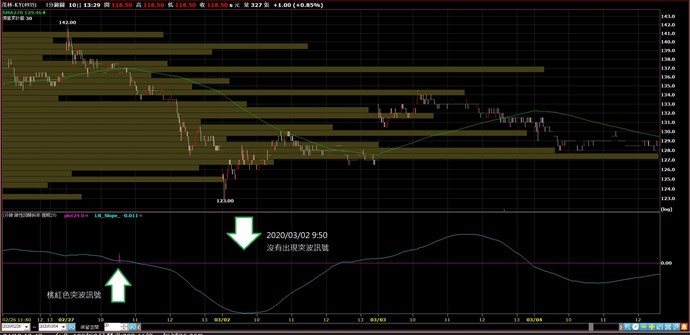
顯示在2020/03/20 9:50 有買進訊號
然而在指標顯示:
2020/03/02 9:50 卻沒有出現桃紅色突波訊號?
請問是我哪裡設定錯誤了,導致策略回測結果和指標顯示的不相同呢?


1 評論