

你好,我以系統內建的"隨機漫步指標"為依據,指標腳本如下:
input:length(10);
setinputname(1, "天期");
variable:RWIH(0),RWIL(0), price(0),position(0),entry_price(0);
value1 = standarddev(close,length,1);
value2 = average(truerange,length);
RWIH = (high-low[length-1])/value2*value1;
RWIL = (high[length-1]-low)/value2*value1;
Value3 = absvalue(RWIH - RWIL);
condition1 = Value3 >20;
condition2 = Value3 <20;
if position = 0 then
begin
if condition1 then
begin
position = 1;
entry_price = close;
print("(ENTRY) Date:", Date, " EntryPrice:", entry_price);
plot1(low , "ENTRY");
end;
end
else
begin
if condition2 then
begin
position = 0;
entry_price = 0;
print("(EXIT) Date:", Date);
plot2(low , "EXIT");
end;
end;
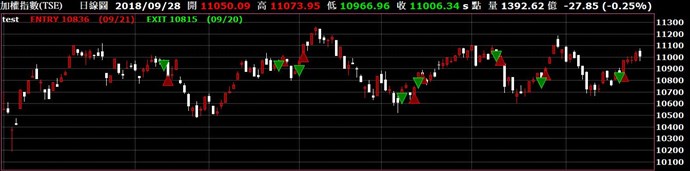
以加權指數作為主圖,疊圖可以正常顯示
但以股票作為主圖,疊圖卻都出現N/A
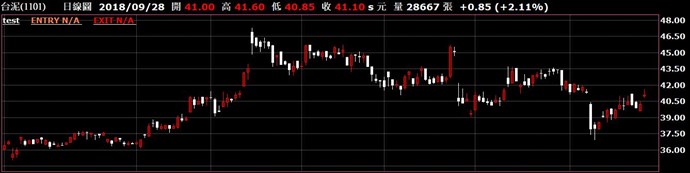
看指標設計邏輯應該只有用到K線的原理,數值>20出現紅三角、數值<20出現綠三角,不過股票卻無法顯示,不曉得是哪裡出了問題?


1 評論